


Christina Nikolova
University of National and World Economy, Sofia, Bulgaria
https://doi.org/10.53656/isct-2025.07

Pages 78-94
Abstract. This paper examines the critically important relationship between the valuation of external transport costs and the assessment of the effectiveness of investment prioritization in road infrastructure. Its primary objective is to demonstrate how the appropriate recognition and valuation of externalities can enhance the decision-making process regarding where and how to invest in the road network.
The report emphasizes that investments in road infrastructure should not be evaluated solely in terms of direct financial costs and benefits. Instead, they must be assessed within the broader context of their overall impact on society and the environment, including external costs such as air pollution, noise, congestion, road accidents, limited access to transportation, and other negative externalities.
The central thesis advanced in the report is that, when prioritizing road infrastructure investments, it is essential to consider how these projects can effectively reduce or prevent such external costs. For instance, investments in bypass roads can help mitigate congestion and pollution in urban centers; the construction of safer roads equipped with proper signage and lighting can contribute to a reduction in traffic accidents; and measures aimed at improving public transport—often supported by quality road infrastructure—can decrease dependency on private vehicles and thus reduce associated external costs.
The paper proposes a methodology for the valorization (monetary valuation) of these externalities, enabling their integration into economic evaluations of investment projects. The conducted analyses and resulting conclusions confirm that road infrastructure investments leading to a reduction in external costs generate greater overall societal benefits. By prioritizing such projects, it is possible to achieve not only economic efficiency but also significant improvements in quality of life, public health, and the sustainability of the transport system.
Ultimately, the study advocates for a more intelligent and responsible management of public funds in the transport sector through the integration of external cost valorization into investment decision-making frameworks.
Keywords: transport externalities; external costs of transport; valorization, infrastructure investment prioritization; investment efficiency; transport policy
- Introduction
In recent decades, the prioritization of public investments in road infrastructure has become a central concern for transport policymakers and public authorities, especially in the context of increasingly limited budgetary resources and growing environmental awareness. The traditional evaluation of such investments has primarily focused on direct financial indicators such as construction costs, maintenance expenditures, and time savings for users. However, this approach neglects an essential dimension of transport activity – its external costs, which affect third parties and the environment without being reflected in market transactions.
Integrating external costs of transport into investment efficiency evaluations is crucial for enhancing the sustainability and economic viability of transportation systems. By internalizing these costs, policymakers can make more informed decisions that reflect the actual societal impacts of transport activities. This integration can be achieved through various methodologies and frameworks that assess the externalities associated with transport.
This paper argues that an integrated evaluation of road infrastructure investments must include the valorization of external transport costs, encompassing the costs of air and noise pollution, congestion, accidents, climate change, and restricted accessibility. These externalities represent a significant societal burden and should be systematically internalized in project appraisal and investment prioritization frameworks.
Building upon the internalization paradigm developed at the European level – particularly through the “user pays” and “polluter pays” principles – this study seeks to demonstrate how properly valuated external costs can serve as a robust criterion for comparing and ranking infrastructure projects. When road investments are prioritized based not only on financial returns but also on their potential to mitigate negative externalities, public funds can be allocated more efficiently and equitably, contributing to both economic performance and societal well-being.
The paper is motivated by the imperative to align national infrastructure strategies with the objectives of the European Green Deal and the Just Transition mechanisms, which emphasize decarbonization, resource efficiency, and fairness. It aims to propose a methodology for the monetary valuation of external costs and to provide empirical insights into how such valuation can support better-informed decisions in road infrastructure planning and funding.
- Methodology
The methodological framework applied in this study builds upon the established European practices in internalizing external transport costs, as presented in the Handbook on the External Costs of Transport [1] and further developed through projects such as UNITE, HEATCO, and CASES. The approach involves two interlinked stages: valuing marginal external costs and integrating them into a decision-support system for investment prioritization [2].
External costs refer to the unaccounted impacts of transport activities on society, including accidents, pollution, and congestion [3]. These costs can be categorized into costs for preventing environmental degradation, health impacts from pollution, and economic losses due to accidents.
2.1 Valuation of External Costs
The external cost components considered in the analysis include:
– Air pollution, based on emissions of NOₓ, SO₂, PM₂.₅, and VOCs;
– Noise pollution is evaluated through health impacts and property value depreciation.
– Congestion is quantified via time loss and increased vehicle operating costs.
– Accidents, including medical costs, loss of productivity, and the value of statistical life.
– Climate change, via carbon pricing of GHG emissions.
– Barrier effects and accessibility deficits are particularly relevant for vulnerable regions and social groups.
For each cost category, unit values (€/vkm or €/tkm) are applied based on updated country-specific correction coefficients, which account for purchasing power parity (PPP), inflation (via HICP), and transport network characteristics. The adjusted marginal cost values are then multiplied by estimated traffic volumes for specific road segments to obtain total external costs by project.
2.2 Cost-Benefit Analysis of Road Rehabilitation Measures
An integral part of the proposed methodological framework involves a cost–benefit analysis (CBA) of road rehabilitation and maintenance interventions. This analysis compares the required investment expenditures for repairing specific road sections with the expected benefits arising from the intervention. The benefits are expressed in both direct and indirect (societal) terms [4], including:
– Direct benefits for road users include improved travel speeds, enhanced ride quality, and reduced vehicle operating costs.
– Reduction in the number and severity of traffic accidents, leading to a corresponding decline in associated social costs, including medical expenses, property damage, and loss of productivity.
– Mitigation of traffic congestion, resulting in time savings for both passenger and freight transport.
– Decreased fuel consumption, contributing to cost savings for transport operators and private users.
– Lower emissions and environmental impact, with associated reductions in the costs of air quality management, climate change mitigation, and ecosystem restoration.
This CBA approach facilitates the identification and prioritization of road segments where maintenance and rehabilitation works are likely to yield the highest net social benefit [5]. By monetizing both internal and external impacts, the analysis supports the efficient allocation of limited infrastructure funding toward projects that offer the most significant savings in direct expenditures and the avoidance of societal costs [6].
2.3 Integration into Investment Prioritization
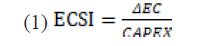
The next step is to incorporate the calculated external cost reductions into the assessment of infrastructure projects. For this purpose, a multicriteria evaluation (MCE) approach is employed, where conventional indicators (e.g., internal rate of return, net present value) are supplemented by an External Cost Savings Index (ECSI). The ECSI is defined as:
where:
– ΔEC is the reduction in total external costs (€/year) due to the investment;
– CAPEX is the capital expenditure of the project (in €).
This index enables a transparent comparison across alternative projects, supporting the prioritization of those that generate the highest societal benefit per euro invested, not only through direct user benefits but also through reduced externalities [7].
The methodology is applied to hypothetical case scenarios involving prioritising investments and major repair works of road infrastructure sections. The valuation results provide actionable insights into how investments with comparable financial performance may differ substantially in terms of their external cost mitigation potential.
- Empirical Application
To demonstrate the practical applicability of the proposed methodology, this study presents an empirical illustration based on selected types of road infrastructure investments, including construction, road safety enhancement, and interurban corridor improvement.
The analysis focuses on a key section of the national road network – National Road II-53, Yambol-Sredets – which connects the North and South of Bulgaria through the Balkan Mountains and is frequently used as an alternative to the heavily trafficked Hemus and Trakia motorways. The route is characterized by challenging terrain, steep gradients, and high levels of heavy goods vehicle (HGV) traffic. The technical condition of the road section under study has deteriorated significantly, with road surface degradation, insufficient signage and lighting, and suboptimal safety infrastructure. As a result, this route is associated with elevated accident rates, longer travel times, and increased fuel consumption – factors that contribute to substantial external costs.
A comparative assessment of the current state and a hypothetical post-rehabilitation scenario was conducted, quantifying the reduction in:
– Time losses for freight and passenger transport;
– Traffic accidents and related social costs;
– Vehicle operating costs, including fuel consumption;
– Noise and air pollution;
– Carbon emissions.
The analysis applied adjusted marginal external cost values (€/vkm) based on the EU Handbook on External Costs and national correction coefficients. The expected reduction in external costs was monetized over a 30-year horizon and discounted using a 5 % social discount rate.
The respective investment costs are described in Table 1 below.
Table 1. Investment costs
| Investment costs | ||||
| With Project (JV) | Total | 2024 | 2025 | 2026 |
| Length, km | 1,100 | |||
| Designing | 67 859,00 | 67 859,00 | ||
| Construction and installation works | 7 464 484,00 | 2 985 793,60 | 2 612 569,40 | 1 866 121,00 |
| Assessment of compliance with the basic requirements for constructions according to Art. 142, para. 6, item 2 of the SDA | 10 179,00 | 10 179,00 | ||
| Construction supervision | 213 756,00 | 85 502,40 | 74 814,60 | 53 439,00 |
| Engineering supervision | 6 786,00 | 2 714,40 | 2 375,10 | 1 696,50 |
| Road safety audit | 10 000,00 | 4 000,00 | 3 500,00 | 2 500,00 |
| Expropriation of properties | 50 000,00 | 50 000,00 | ||
| Archeology | 50 000,00 | 50 000,00 | ||
| Environment impact assessment procedures | 50 000,00 | 50 000,00 | ||
| Staff costs, publicity and visualization, etc. taxi | 79 230,00 | 31 692,00 | 27 730,50 | 19 807,50 |
| TOTAL: | 8 002 294,00 | 3 337 740,40 | 2 720 989,60 | 1 943 564,00 |
Source: National Road Infrastructure Agency, 2024
The initial maintenance and operation costs have been calculated based on the scenarios, with or without investments (see Table 2).
Table 2. Costs for maintenance and operation (EUR)
| Minimal impact option | Years | Total | 2024 | 2025 | 2026 | 2027 | 2028 | 2029 | 2030 | 2031 | 2032 | 2033 | |||||
| Without project | Unit of Cost | ||||||||||||||||
| Road II-53 (2 lanes) (length) | 1,10 km | ||||||||||||||||
| Current activities | |||||||||||||||||
| Ongoing maintenance | 1 268 | 84 972 | 1395 | 1465 | 1538 | 1615 | 1696 | 1780 | 1869 | 1963 | 2061 | 2164 | |||||
| Winter maintenance | 822 | 60 078 | 904 | 949 | 997 | 1047 | 1099 | 1154 | 1212 | 1272 | 1336 | 1403 | |||||
| Total current expenditure | 2 090 | 143 382 | 2299 | 2414 | 2535 | 2662 | 2795 | 2934 | 3081 | 3235 | 3397 | ||||||
| Recurring activities | |||||||||||||||||
| Preventive repairs | 133 637 | 599 511 | 228047 | ||||||||||||||
| Total recurring costs | 599 511 | 228047 | |||||||||||||||
| Total maintenance costs – option „without project“ | 730 187 | 2299 | 2414 | 2535 | 2662 | 2795 | 2 934 | 3081 | 3235 | 3397 | 228047 | ||||||
| Other costs | |||||||||||||||||
| Labour | 18% | 133 721 | 414 | 435 | 456 | 479 | 503 | 528 | 555 | 582 | 611 | 41048 | |||||
| Materials | 64% | 447 916 | 1472 | 1545 | 1622 | 1703 | 1789 | 1878 | 1972 | 2071 | 2174 | 145950 | |||||
| Equipment | 8% | 55 990 | 184 | 193 | 203 | 213 | 224 | 235 | 246 | 259 | 272 | 18244 | |||||
| Other costs | 10% | 69 987 | 230 | 241 | 253 | 266 | 279 | 293 | 308 | 324 | 340 | 22805 | |||||
| With project | |||||||||||||||||
| Current activities | |||||||||||||||||
| Ongoing maintenance | 1 268 | 62 180 | 1615 | 1696 | 1780 | 1869 | 1963 | 2061 | 2164 | ||||||||
| Winter maintenance | 822 | 40 307 | 1047 | 1099 | 1154 | 1212 | 1272 | 1336 | 1403 | ||||||||
| Total current expenditure | 90 873 | 2662 | 2795 | 2934 | 3081 | 3235 | 3397 | 3567 | |||||||||
| Recurring activities | |||||||||||||||||
| Preventive repairs | 133 637 | 675 062 | |||||||||||||||
| Total recurring costs | 675 062 | ||||||||||||||||
| Total maintenance costs – option „with project“ | 760 479 | 2934 | 3081 | 3235 | 3397 | 3567 | |||||||||||
| Total costs for the existing road | 238 122 | 2299 | 2414 | 2535 | 887 | 932 | 978 | 1027 | 1078 | 1132 | 76016 | ||||||
| Total costs – option “with project” | 998 601 | 2299 | 2414 | 2535 | 887 | 932 | 3913 | 4108 | 4314 | 4529 | 79582 | ||||||
| Other costs | |||||||||||||||||
| Labour | 18% | 179 748 | 414 | 435 | 456 | 160 | 168 | 704 | 739 | 776 | 815 | 14325 | |||||
| Materials | 64% | 639 105 | 1472 | 1545 | 1622 | 568 | 596 | 2504 | 2629 | 2761 | 2899 | 50933 | |||||
| Equipment | 8% | 79 888 | 184 | 193 | 203 | 71 | 75 | 313 | 329 | 345 | 362 | 6367 | |||||
| Other costs | 10% | 99 860 | 230 | 241 | 253 | 89 | 93 | 391 | 411 | 431 | 453 | 7958 | |||||
| Cost Savings
( option “without project”- option „with project“) |
-298 731 | 0 | 0 | 0 | 1774 | 1863 | -978 | -1027 | -1078 | -1132 | 148464 | ||||||
Source: Authors’ calculations
These investment types (with or without new investments) were chosen due to their varying impacts on external cost categories and their relevance to current policy debates regarding sustainable transport and decarbonization strategies.
The scenario in the example provided was assessed in terms of:
– Baseline option (without investments) and projected traffic volumes (veh/day);
– Road user characteristics (vehicle type, fuel type, emission standards);
– Local environmental and socio-economic conditions (e.g., population density, accident rates, background pollution levels);
– Expected changes in externalities due to project implementation (e.g., reduced congestion, emissions, accident frequency).
The marginal external cost values were drawn from the most recent update of the Handbook on the External Costs of Transport [1] and adjusted for national conditions using PPP and HICP-based coefficients. The assessment took into account the specific external cost structure of road transport in Bulgaria, where traffic patterns, fleet composition, and infrastructure conditions differ from those in other European countries.
For each scenario, the reduction in external costs was estimated for a 30-year analysis period using discounted cash flows. These values were then used to calculate the External Cost Savings (ECS), as introduced in the methodology section, and External Cost Savings Index (ECSI) allowing for comparison across cases (see Appendix 1, Table 1, which presents the evaluation of costs and benefits for the first 10 years of investment).
- Risk analysis
In the evaluation of the effectiveness of investments in large infrastructure projects, it is required to conduct a risk assessment, in accordance with EU Regulation No. 1303/2013 [8]. The risk assessment involves examining the probability that a given project will achieve satisfactory performance—specifically, in relation to a predefined threshold value of the internal rate of return (IRR) or net present value (NPV).
The term “probability” in this context refers to an index that takes the value of 1 when there is full certainty that a given forecast will be confirmed, and 0 when there is certainty that the forecast will not be confirmed, with intermediate values representing varying degrees of confidence between these two extremes.
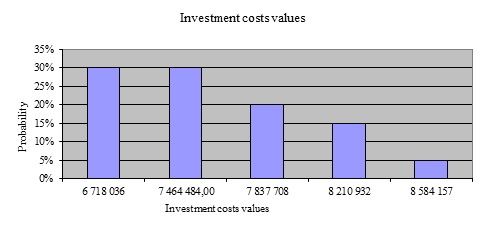
Source: Author’s own calculations
Figure 1. Risk analysis of investments
The chart on fig. 1 illustrates the probability distribution of a project’s internal rate of return (IRR) based on a range of possible future scenarios. Each bar represents the relative frequency or probability that the IRR will fall within a specific interval (e.g., 2 – 4%, 4 – 6%, etc.), reflecting uncertainty in key project parameters such as investment costs, traffic volumes, or externalities.
In the context of risk assessment – as required under EU Regulation No. 1303/2013 – this distribution supports the estimation of the probability that the project will achieve satisfactory performance. A predefined IRR threshold (e.g., 5%) serves as a benchmark for acceptability. The combined height of the bars to the right of this threshold reflects the estimated probability of success, while the bars to the left represent the risk of failure or underperformance.
This probabilistic approach allows for a more realistic and transparent assessment of infrastructure investments by incorporating the variability of inputs, rather than relying solely on deterministic point estimates. It enables decision-makers to prioritize projects not only by expected returns, but also by the degree of confidence that such returns will be achieved.
- Sensitivity analysis
Sensitivity analysis enables the identification of the critical variables or parameters within the model – those whose fluctuations, whether positive or negative, exert the greatest impact on the financial and/or economic performance of the project. The analysis is conducted by altering one variable at a time and assessing the resulting effect on key outcome indicators, such as the Financial Net Present Value (FNPV) or Economic Net Present Value (ENPV).
The criteria for selecting critical variables may vary depending on the specific nature of the project and should be clearly defined on a case-by-case basis. As a general guideline, it is recommended to consider those variables or parameters for which an absolute deviation of 1% from the baseline estimate results in a corresponding deviation of no less than 1% in the NPV- i.e., those with a unitary or greater elasticity.
In the case study presented here, the sensitivity analysis focuses on variables that influence the financial return on investment (FNPV-C) and the financial return on equity (FNPV-K), in order to identify the most influential risk factors affecting the project’s viability.
Source: Author’s own calculations
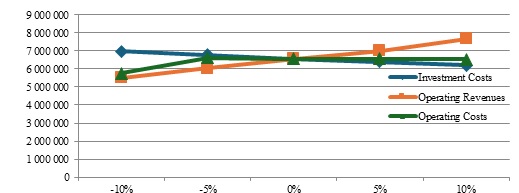
Figure 2. Sensitivity analysis based on FNPV-C
Figure 2 illustrates the sensitivity of three key financial components – investment costs, operating revenues, and operating costs – to symmetrical variations of ±10%. The x-axis represents the magnitude of variation, while the y-axis shows the absolute financial impact (in EUR).
The analysis reveals that operating revenues exhibit the steepest gradient, indicating that fluctuations in revenue have the most significant effect on the project’s financial outcomes. In contrast, investment costs demonstrate lower sensitivity across the variation range, suggesting that the project is more resilient to moderate changes in capital expenditure. Operating costs show a moderate, but still noticeable, impact.
This result implies that accurate estimation and control of revenue-generating assumptions – such as traffic volumes, tariff levels, and service quality—are crucial for maintaining project viability. A small deviation in these parameters could result in a disproportionate effect on net cash flows and ultimately on indicators such as FNPV and IRR.
Source: Author’s own calculations
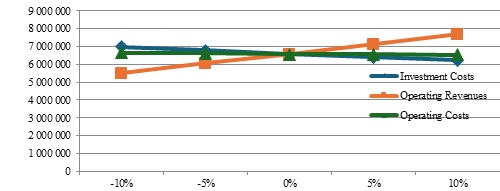
Figure 3. Sensitivity analysis based on FNPV-K
Figure 3 likewise presents the influence of ±10% deviations in investment costs, operating revenues, and operating costs on the financial net present value for equity capital (FNPV-K). Compared to the analogous chart for FNPV-C, the graph shows heightened sensitivity of equity-related returns to variations in operating revenues, which again exhibit the steepest response. This is expected, as FNPV-K reflects the returns to project promoters and investors after financing and public contributions are taken into account. As such, the net cash flow to equity holders is directly influenced by fluctuations in income streams and cost control. Even modest changes in revenue assumptions (e.g., lower-than-expected toll collection or service uptake) may significantly erode the financial attractiveness of the project from the perspective of private stakeholders.
- Results and Discussion
The empirical application of the approach confirms that external cost savings can substantially influence the ranking of road infrastructure projects when integrated into investment decision-making frameworks. The following key findings emerged from the analysis:
– The option with investments demonstrated the highest ECSI values due to their significant effect on reducing travel times and air pollution. In one case, an estimated reduction of over 30% in peak-hour travel time translated into substantial time cost savings and air quality improvements.
– Safety-oriented improvements following investments, such as enhanced signage, road widening, and intersection redesigns, demonstrated strong performance in reducing accident-related externalities, particularly in high-risk segments of national roads. These projects produced moderate to high ECSI values depending on local accident rates and traffic intensity.
– Capacity-enhancing effects on interurban corridors showed mixed results. While they yielded positive outcomes in terms of travel time and fuel efficiency, their impact on external cost reduction was less pronounced unless accompanied by traffic diversion from urban routes.
The results confirm the hypothesis that incorporating external cost valorization shifts investment priorities toward projects with broader societal and environmental benefits, even when their direct financial returns appear modest. This supports the integration of marginal cost valuation into mainstream cost-benefit analysis (CBA) frameworks used in national and EU-level transport planning [9].
Notably, the findings highlight that marginal external costs are highly context-dependent; therefore, the use of average values or unadjusted European estimates can result in misleading conclusions. Tailoring the external cost component to local conditions is essential for meaningful investment decisions.
- Policy Implications
The integration of external cost valorization into transport investment appraisal has significant implications for policy-making and public budgeting:
– Enhanced cost-effectiveness of infrastructure spending: Projects that generate high societal returns through reduced externalities can be prioritized, leading to smarter allocation of limited public funds [10].
– Alignment with EU environmental goals: By incorporating external costs such as those for mitigating the GHG emissions and air pollution, the proposed framework contributes to the objectives of the European Green Deal and Just Transition Mechanism.
– Support for modal shift and sustainable transport: Investments that reduce reliance on private car use (e.g., through improved public transport infrastructure) receive higher appraisal scores, encouraging a systemic transition to more sustainable mobility patterns [11].
– Evidence-based public engagement and transparency: The use of quantifiable and monetized externalities strengthens the legitimacy and accountability of public investment decisions [12], which is essential in participatory governance environments.
– Basis for infrastructure charging reform: The results can inform the introduction or adjustment of user charges and tolls to reflect actual social costs, further internalizing externalities and providing incentives for more sustainable transport behavior [13].
In conclusion, the valorization of external costs is not only a technical refinement of investment analysis but also a strategic policy tool that enables more equitable, efficient, and sustainable development of transport infrastructure.
Conclusions
This paper addresses the critical link between the valorization of external transport costs and the effectiveness of prioritizing road infrastructure investment. It has been demonstrated that integrating properly valued externalities into project appraisal frameworks enables a more comprehensive understanding of societal costs and benefits, extending beyond the traditional confines of financial analysis.
The proposed methodology, building on the marginal cost principle and adapted to national and regional conditions, offers a structured approach for incorporating environmental, health, and congestion-related impacts into decision-making. By applying this framework to selected road investment scenarios, the study confirmed that projects with relatively modest financial returns may in fact, yield considerable societal benefits through the reduction of external costs.
Several key conclusions emerge from this research:
– External costs such as air pollution, congestion, accidents, and noise represent a significant portion of the total societal cost of road transport and must be accounted for in investment analysis.
– Prioritizing infrastructure projects based on their potential to reduce these costs leads to more sustainable, equitable, and cost-effective outcomes.
– The External Cost Savings Index (ECSI) proposed in this paper provides a practical and transparent metric for comparing alternative investments and aligning infrastructure planning with societal objectives.
– The approach supports broader policy goals related to the European Green Deal, climate neutrality, and sustainable urban development.
The findings underscore the need for policymakers, infrastructure managers, and funding institutions to adopt comprehensive valuation frameworks that reflect the full societal impact of transportation investments. Future research may expand this approach to multi-modal comparisons and dynamic pricing mechanisms, offering a deeper foundation for integrated transport policy and infrastructure governance.
Funding
This research was funded by the Bulgarian National Scientific Research Fund, Grant Agreement No KP-06-N55/15 of 22.11.2021.
REFERENCES
[1] EUROPEAN COMMISSION, Handbook on the External Costs of Transport: Version 2019 – 1.1, Directorate-General for Mobility and Transport, Brussels: Publications Office, 2020.
[2] NIKOLOVA, C., Providing Sustainable Transport Infrastructure through Internalization of External Costs: A Case Study from South-Eastern European Countries. In A. D. Pietro, J. Marti (eds.), Critical Infrastructure – Modern Approach and New Developments, 2022, IntechOpen, London. doi: 10.5772/intechopen.108429 ISBN 978-1-83768-108-2. https://www.intechopen.com/online-first/84775.
[3] JOKANOVIĆ, I., HOWAIDA, K., Methods for Estimation of External Costs of Transport. no. 26, Jan. 2014, pp. 149–58, 2014, doi:10.14415/ZBORNIKGFS26.15.
[4] LU, Z, LING JI., Transportation Cost Analysis Considering Energy Security and External Costs. Journal of Transportation Engineering and Information, vol. 2, issue 1, 2004, https://doi.org/10.3969/j.issn.1672-4747.2004.01.015.
[5] GALKIN, A., TKACHENKO, I., HRIEKOVA, O., Efficiency Evaluation of the Transport Operations of Shipment Delivery, Including the External Environment Impact, Municipal Economy of Cities, vol. 4, no. 164, pp. 252 – 257, October 1, 2021, https://doi.org/10.33042/10.33042/2522-1809-2021-4-164-252-257.
[6] GRZELAKOWSKI, A. S., The Concept of Internalisation of the External Costs of Transport in the EU’ and Its Impact on the Efficiency of Transport Systems and the Performance of Logistics Supply Chains. Research Papers of Wroclaw University of Economics and Business, vol. 64, no. 3, Jan. 2020, pp. 161 – 174, https://doi.org/10.15611/PN.2020.3.13.
[7] MENDZINS, K., BARISA, A., Transport External Costs Evaluation Case Study. International Scientific Conference of Environmental and Climate Technologies, 2023 CONNECT Book of Abstracts, 132. https://doi.org/10.7250/conect.2023.102.
[8] OFFICIAL JOURNAL OF THE EC., Regulation (EU) No 1303/2013 of the European Parliament and of the Council of 17 December 2013 laying down common provisions on the European Regional Development Fund, the European Social Fund, the Cohesion Fund, the European Agricultural Fund for Rural Development and the European Maritime and Fisheries Fund and laying down general provisions on the European Regional Development Fund, the European Social Fund, the Cohesion Fund and the European Maritime and Fisheries Fund and repealing Council Regulation (EC) No 1083/2006, isuue 34720.12.2013, 320 p., http://data.europa.eu/eli/reg/2013/1303/2024-03-01.
[9] CAI, M., ZHOU, Z. A., Review of Evaluation of External Costs in Road Transport. Journal of Sun Yat-sen University (Natural Science Edition). 2015, 54 (04), https://doi.org/10.13471/j.cnki.acta.snus.2015.04.001.
[10] SAVCHENKO, L., TSAPENKO, O., Interrelation of external costs of road transport and financial and logistics indicators of the EU countries. Intellectualization of Logistics and Supply Chain Management, vol. 17, issue 2, pp. 23 – 34, 2023, https://doi.org/10.46783/smart-scm/2023-17-2.
[11] KOBA, R., LIPKA, P., KALINOWSKI, M., CZAPLEWSKI, K., WITKOWSKA, J., WEINTRIT, A., External Transport Costs and Implications for Sustainable Transport Policy. Sustainability, vol. 16, issue 22, 2024 – 9684, https://doi.org/10.3390/su16229687.
[12] CALTHROP, E., DE BORGER, B., PROOST, S., Cost-Benefit Analysis of Transport Investments in Distorted Economies. Social Science Research Network, 2008, https://doi.org/10.2139/SSRN.1268222.
[13] RAICU, S., COSTESCU, D., POPA, M., ROSCA, M., Including negative externalities during transport infrastructure construction in assessment of investment projects. European Transport Research Review, vol. 11(1), pp. 1 – 15, 2019, https://doi.org/10.1186/S12544-019-0361-9.
Prof. Dr Christina Nikolova
ORCID iD: 0000-0002-0966-5872
Department of Transport and Energy Economics
University of National and World Economy
19, Osmi Dekemvri St.
1700 Sofia, Bulgaria
E-mail: hrnikolova@unwe.bg
APPENDIX 1
Table 1. Economic Analysis
| 1 | Years of the project | 30 | |||||||||
| 2 | Discount rate in economic analysis | 5 | |||||||||
| 3 | Years | 2024 | 2025 | 2026 | 2027 | 2028 | 2029 | 2030 | 2031 | 2032 | 2033 |
| Harmonized Index of Consumer Prices* | 2,3 | 2,1 | 1,9 | 1,7 | 1,6 | 1,4 | 1,2 | 1,0 | 0,9 | 0,7 | |
| 4 | Traffic without a project | 2024 | 2025 | 2026 | 2027 | 2028 | 2029 | 2030 | 2031 | 2032 | 2033 |
| Cars | 2231194 | 2382265 | 2543566 | 2715788 | 2899671 | 3096004 | 3305631 | 3529452 | 3768427 | 4023583 | |
| Heavy Goods Vehicles | 899491 | 965375 | 1036085 | 1111975 | 1193423 | 1280837 | 1374654 | 1475343 | 1583406 | 1699385 | |
| Buses & Coaches | 4300 | 4102 | 3914 | 3734 | 3562 | 3398 | 3242 | 3092 | 2950 | 2814 | |
| 5 | Traffic from the project | 2024 | 2025 | 2026 | 2027 | 2028 | 2029 | 2030 | 2031 | 2032 | 2033 |
| Cars | 2 754 352 | 2 940 846 | 3 139 968 | 3 352 571 | 3 579 570 | 3 821 939 | 4 080 718 | ||||
| Heavy Goods Vehicles | 1 127 765 | 1 210 370 | 1 299 025 | 1 394 174 | 1 496 293 | 1 605 891 | 1 723 516 | ||||
| Buses & Coaches | 3 787 | 3 612 | 3 446 | 3 288 | 3 136 | 2 992 | 2 854 | ||||
| 6 | Baseline values of travel time (EUR/hour) (Table 87/p. 246 of [1]) | 2024 | 2025 | 2026 | 2027 | 2028 | 2029 | 2030 | 2031 | 2032 | 2033 |
| Cars | 9 | 8,68 | 8,66 | 8,65 | 8,63 | 8,62 | 8,60 | 8,59 | 8,57 | 8,56 | |
| Heavy Goods Vehicles | 8,18 | 8,17 | 8,15 | 8,14 | 8,13 | 8,11 | 8,10 | 8,08 | 8,07 | 8,06 | |
| Buses & Coaches | 201,56 | 200,85 | 200,14 | 199,44 | 198,73 | 198,03 | 197,33 | 196,63 | 195,93 | 195,23 | |
| 7 | Elasticity of travel costs (Table 89/p.249 of [1]) | ||||||||||
| Cars | -0,56 | -0,56 | -0,56 | -0,56 | -0,56 | -0,56 | -0,56 | -0,56 | -0,56 | -0,56 | |
| Heavy Goods Vehicles | -0,30 | -0,30 | -0,30 | -0,30 | -0,30 | -0,30 | -0,30 | -0,30 | -0,30 | -0,30 | |
| Buses & Coaches | -0,30 | -0,30 | -0,30 | -0,30 | -0,30 | -0,30 | -0,30 | -0,30 | -0,30 | -0,30 | |
| 8 | Travel time | 0,0138 | 0,0138 | 0,0138 | 0,0138 | 0,0138 | 0,0138 | 0,0138 | 0,0138 | 0,0138 | 0,0138 |
| Without project | 2024 | 2025 | 2026 | 2027 | 2028 | 2029 | 2030 | 2031 | 2032 | 2033 | |
| Cars | 30679 | 32756 | 34974 | 37342 | 39870 | 42570 | 45452 | 48530 | 51816 | 55324 | |
| Heavy Goods Vehicles | 12368 | 13274 | 14246 | 15290 | 16410 | 17612 | 18901 | 20286 | 21772 | 23367 | |
| Buses & Coaches | 59 | 56 | 54 | 51 | 49 | 47 | 45 | 43 | 41 | 39 | |
| With project | 2024 | 2025 | 2026 | 2027 | 2028 | 2029 | 2030 | 2031 | 2032 | 2033 | |
| Cars | 37872 | 40437 | 43175 | 46098 | 49219 | 52552 | 56110 | ||||
| Heavy Goods Vehicles | 15507 | 16643 | 17862 | 19170 | 20574 | 22081 | 23698 | ||||
| Buses & Coaches | 52 | 50 | 47 | 45 | 43 | 41 | 39 | ||||
| Value of travel time without project (euro) | 2024 | 2025 | 2026 | 2027 | 2028 | 2029 | 2030 | 2031 | 2032 | 2033 | |
| Cars | 266672 | 284242 | 302969 | 322929 | 344202 | 366876 | 391042 | 416799 | 444251 | 473510 | |
| Heavy Goods Vehicles | 101183 | 108409 | 116151 | 124445 | 133331 | 142851 | 153050 | 163977 | 175684 | 188226 | |
| Buses & Coaches | 11917 | 11329 | 10770 | 10238 | 9733 | 9252 | 8795 | 8361 | 7948 | 7555 | |
| Total | 379773 | 403981 | 429890 | 457612 | 487266 | 518979 | 552888 | 589137 | 627883 | 669291 | |
| Value of travel time with a project (euro) | 2024 | 2025 | 2026 | 2027 | 2028 | 2029 | 2030 | 2031 | 2032 | 2033 | |
| Cars | 183408 | 195490 | 208368 | 222093 | 236722 | 252313 | 268931 | ||||
| Heavy Goods Vehicles | 37864 | 40567 | 43464 | 46567 | 49892 | 53454 | 57270 | ||||
| Buses & Coaches | 3115 | 2961 | 2815 | 2676 | 2544 | 2418 | 2299 | ||||
| Total | 0,00 | 0,00 | 0,00 | 224387 | 239019 | 254647 | 271336 | 289157 | 308185 | 328499 | |
| EXTERNAL COSTS SAVINGS | 2024 | 2025 | 2026 | 2027 | 2028 | 2029 | 2030 | 2031 | 2032 | 2033 | |
| 9 | Time saving (euro) | ||||||||||
| Cars | 139521 | 148712 | 158508 | 168949 | 180077 | 191938 | 204579 | ||||
| Heavy Goods Vehicles | 86581 | 92764 | 99387 | 106483 | 114085 | 122230 | 130956 | ||||
| Buses & Coaches | 7123 | 6772 | 6437 | 6119 | 5817 | 5530 | 5257 | ||||
| Benefits of Time Savings – General | 233225 | 248247 | 264332 | 281551 | 299980 | 319698 | 340792 | ||||
| Net present value of time savings (euro) | 191874,87 | 194507,93 | 197248,73 | 200093,27 | 203038,05 | 206080,01 | 209216,49 | ||||
| 10 | Benefits of reducing accidents | 2024 | 2025 | 2026 | 2027 | 2028 | 2029 | 2030 | 2031 | 2032 | 2033 |
| Reduction of fatalities | 0,00 | 0 | 0 | 0 | 0 | 0 | 0 | 0 | 0 | 0 | |
| Cost factor (EUR/fatality)) | 2215679 | 2261954 | 2305247 | 2345344 | 2382043 | 2415158 | 2444517 | 2469965 | 2491366 | 2508603 | |
| Correction coefficient (Table 5/ p. 40 of [1]) | 1,00 | 1,00 | 1,00 | 1,00 | 1,00 | 1,00 | 1,00 | 1,00 | 1,00 | 1,00 | |
| Benefits of reducing the number of fatalities in road accidents | 0 | 0 | 0 | 0 | 0 | 0 | 0 | 0 | 0 | 0 | |
| Discounted values (EUR) | 0 | 0 | 0 | 0 | 0 | 0 | 0 | 0 | 0 | 0 | |
| Reduction in the number of seriously injured | 0,00 | 0,00 | 0,00 | 0,80 | 0,80 | 0,80 | 0,80 | 0,80 | 0,80 | 0,80 | |
| Cost factor (EUR/seriously injured) | 312298 | 318821 | 324923 | 330574 | 335747 | 340415 | 344553 | 348140 | 351156 | 353586 | |
| Correction factor | 1,25 | 1,25 | 1,25 | 1,25 | 1,25 | 1,25 | 1,25 | 1,25 | 1,25 | 1,25 | |
| Benefits of reducing the number of seriously injured people in road accidents | 0 | 0 | 0 | 328946 | 334093 | 338737 | 342855 | 346424 | 349426 | 351844 | |
| Discounted values (EUR) | 0 | 0 | 0 | 270624 | 261771 | 252771 | 243661 | 234474 | 225243 | 216001 | |
| Total Accident Reduction Benefits (EUR) – Discounted Values | 0,00 | 0,00 | 0,00 | 270624,41 | 261770,57 | 252771,13 | 243660,81 | 234473,69 | 225243,11 | 216001,40 | |
| 11 | Greenhouse gas emission reduction benefits | 2024 | 2025 | 2026 | 2027 | 2028 | 2029 | 2030 | 2031 | 2032 | 2033 |
| Cost factor (euro/car/hour) (average values Table 136/pages 322-324 of [1]) | |||||||||||
| Cars | 0,0056 | 0,0057 | 0,0059 | 0,0060 | 0,0060 | 0,0061 | 0,0062 | 0,0063 | 0,0063 | 0,0064 | |
| Heavy Goods Vehicles | 0,0261 | 0,0266 | 0,0271 | 0,0276 | 0,0280 | 0,0284 | 0,0288 | 0,0291 | 0,0293 | 0,0295 | |
| Buses & Coaches | 0,0147 | 0,0150 | 0,0153 | 0,0156 | 0,0158 | 0,0161 | 0,0162 | 0,0164 | 0,0166 | 0,0167 | |
| Benefits of reducing greenhouse gas emissions (based on travel time reductions) | |||||||||||
| Cars | 0 | 0 | 0 | 830,65 | 899,23 | 971,79 | 1048,39 | 1129,08 | 1213,87 | 1302,77 | |
| Heavy Goods Vehicles | 0 | 0 | 0 | 2389,92 | 2600,63 | 2825,06 | 3063,56 | 3316,45 | 3584,01 | 3866,43 | |
| Buses & Coaches | 0 | 0 | 0 | 111,03 | 107,20 | 103,33 | 99,42 | 95,49 | 91,56 | 87,64 | |
| Benefits of reducing greenhouse gas emissions – Total | 0 | 0 | 0 | 3331,60 | 3607,07 | 3900,18 | 4211,37 | 4541,02 | 4889,44 | 5256,84 | |
| Discounted values (EUR) – Total | 0,00 | 0,00 | 0,00 | 2740,92 | 2826,23 | 2910,37 | 2992,94 | 3073,54 | 3151,78 | 3227,24 | |
| 12 | Noise Reduction Benefits | 2024 | 2025 | 2026 | 2027 | 2028 | 2029 | 2030 | 2031 | 2032 | 2033 |
| Cost factor (euro/car/hour) (average values Table 35/page 97 of [1]) | |||||||||||
| Cars | 0,0097 | 0,0105 | 0,0114 | 0,0123 | 0,0133 | 0,0144 | 0,0156 | 0,0168 | 0,0182 | 0,0196 | |
| Heavy Goods Vehicles | 0,0633 | 0,0685 | 0,0740 | 0,0801 | 0,0866 | 0,0936 | 0,1012 | 0,1093 | 0,1182 | 0,1277 | |
| Buses & Coaches | 0,0508 | 0,0550 | 0,0595 | 0,0643 | 0,0695 | 0,0752 | 0,0813 | 0,0878 | 0,0949 | 0,1026 | |
| Benefits of reducing greenhouse gas emissions (based on travel time reductions) | |||||||||||
| Cars | 0 | 0 | 0 | 1718,50 | 1980,54 | 2282,23 | 2629,53 | 3029,29 | 3489,35 | 4018,75 | |
| Heavy Goods Vehicles | 0 | 0 | 0 | 6931,83 | 8030,24 | 9301,46 | 10772,51 | 12474,56 | 14443,62 | 16721,28 | |
| Buses & Coaches | 0 | 0 | 0 | 458,19 | 470,96 | 484,02 | 497,37 | 511,02 | 524,98 | 539,24 | |
| Benefits of reducing greenhouse gas emissions – Total | 0 | 0 | 0 | 9108,52 | 10481,73 | 12067,71 | 13899,41 | 16014,87 | 18457,95 | 21279,27 | |
| Discounted values (EUR) – TOTAL | 0,00 | 0,00 | 0,00 | 7493,60 | 8212,71 | 9005,11 | 9878,05 | 10839,49 | 11898,16 | 13063,63 | |
| EXTERNAL COSTS SAVINGS – TOTAL (9+10+11+12) – undiscounted | 0,00 | 0,00 | 0,00 | 574610,89 | 596428,63 | 619037,54 | 642517,33 | 666960,00 | 692471,12 | 719171,24 | |
| EXTERNAL COSTS SAVINGS – TOTAL (9+10+11+12) – discounted | 0,00 | 0,00 | 0,00 | 472733,80 | 467317,44 | 461935,35 | 456625,07 | 451424,78 | 446373,06 | 441508,76 | |
| CAPITAL EXTENDITURES | 5 136 119,01 | ||||||||||
| EXTERNAL COSTS SAVINGS | 46 552 051,34 | ||||||||||
| ECSI | 9,06 | ||||||||||
*https://infostat.nsi.bg/infostat/pages/reports/result.jsf?x_2=664

Свързани статии:
 Analysis of the Average Speeds of Passenger Trains in Bulgaria on the Main Railway Routes, according to the Annual Train Schedule for 2025
The Place and Role of AI in Transport Systems Management
Implementation of Sustainable Indicators for Effective Evaluation and Monitoring of Transport Projects
Analysis and Challenges for IoT & AI in Building and Implementing Smart Rail Transport Systems
Analysis of the Average Speeds of Passenger Trains in Bulgaria on the Main Railway Routes, according to the Annual Train Schedule for 2025
The Place and Role of AI in Transport Systems Management
Implementation of Sustainable Indicators for Effective Evaluation and Monitoring of Transport Projects
Analysis and Challenges for IoT & AI in Building and Implementing Smart Rail Transport Systems